Graphics
Interactivity
Basics
To handle events on plot, pass boolean arguments for click, dblclick, hover, and brush. Their values will be accessed via combination of output plot ID and event type.
click: the value will be accessed viainput.{id}_click(), where{id}is replaced with ID of the plot. The input value will be a dictionary withxandyelements indicating the mouse position.dblclick: the value will be accessed viainput.{id}_dblclick(), where{id}is replaced with ID of the plot. The input value will be a dictionary withxandyelements indicating the mouse position.hover: the value will be accessed viainput.{id}_hover(), where{id}is replaced with ID of the plot. The input value will be a dictionary withxandyelements indicating the mouse position.brush: the value will be accessed viainput.{id}_brush(), where{id}is replaced with ID of the plot. The value will be a dictionary withxmin,xmax,ymin, andymaxelements indicating the brush area.
examples/action-graphics/plot-click/app.py
from shiny import App, render, ui, req
from matplotlib import pyplot as plt
from pydataset import data

mtcars = data("mtcars")

app_ui = ui.page_fluid(
    ui.output_plot("plot", click=True),
    ui.output_text_verbatim("info"),
)

def server(input, output, session):
    @render.plot
    def plot():
        res = plt.scatter(mtcars['wt'], mtcars['mpg'])
        return res

    @render.text
    def info():
        req(input.plot_click())
        x = round(input.plot_click()['x'], 2)
        y = round(input.plot_click()['y'], 2)
        return f"[{x}, {y}]"

app = App(app_ui, server)req() is used to make sure that the app does not do anything before the first click. This will be more discussed in later chapters.
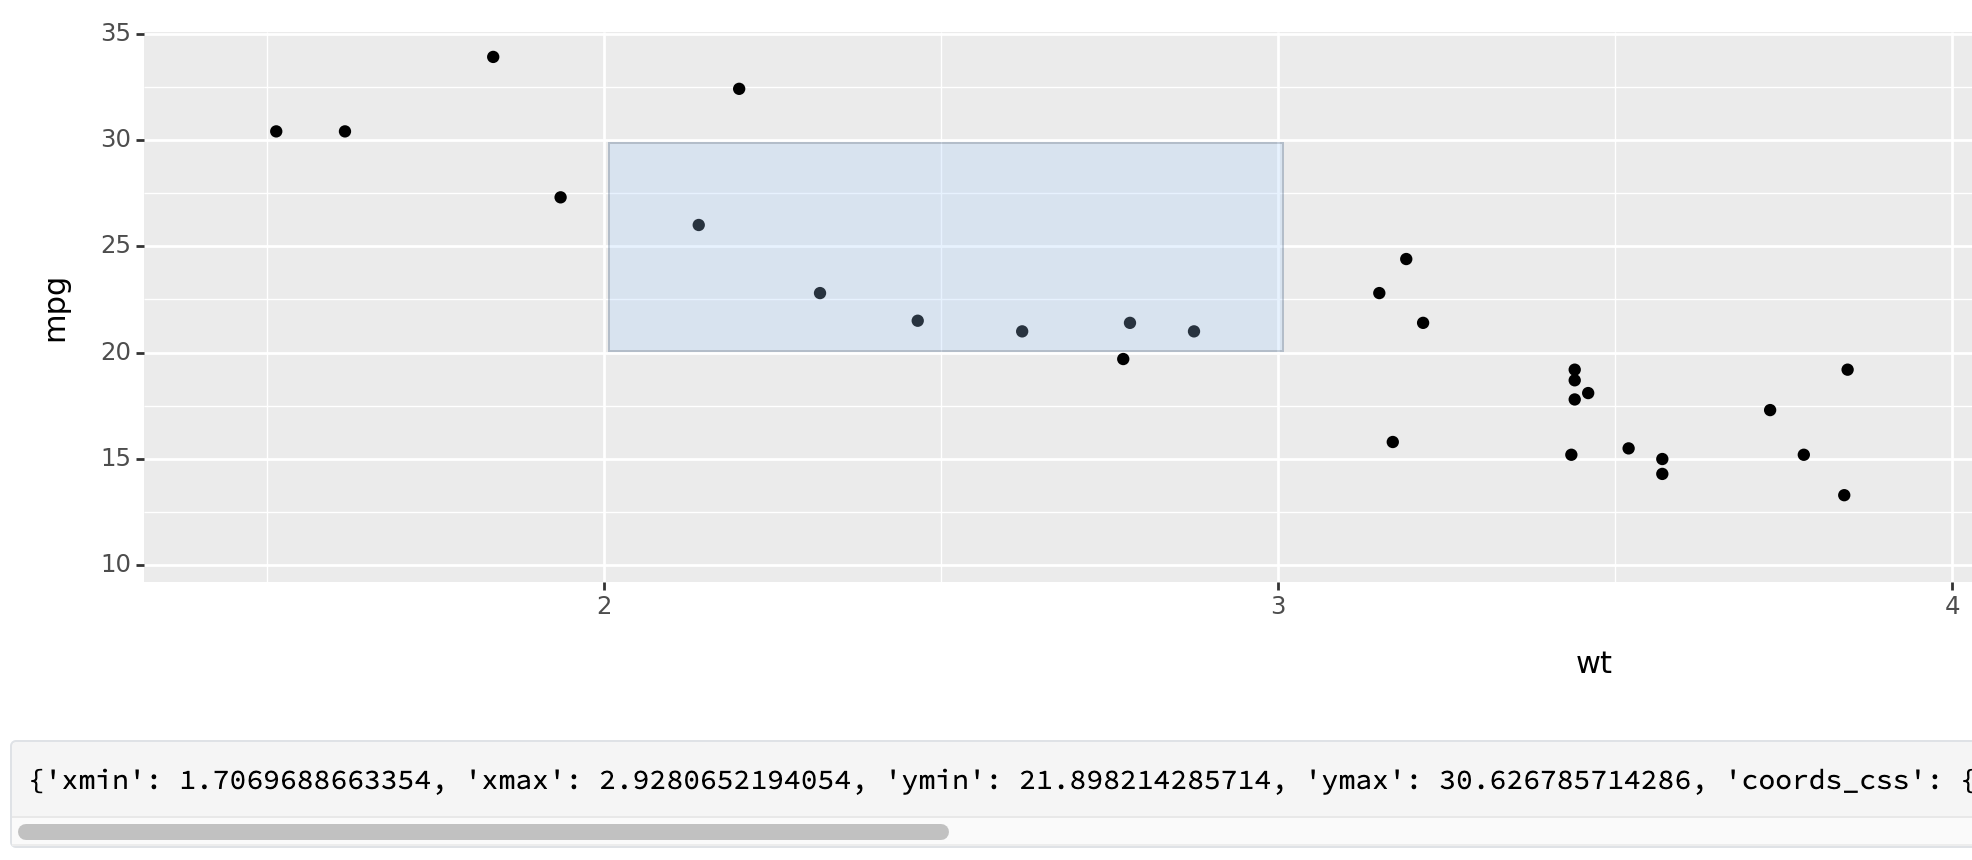
It did not work well with plot created by using {plotnine} package; the mouse position in input value did not align with actual event. For example, a snapshot below shows that I dragged a region for [2, 3] on x-axis and [20, 30] on y-axis, but the input values were read as [1.7, 2.9] for x-axis and [21.9, 30.6] for y-axis.
Clicking
Prints data points near the click.
examples/action-graphics/near-points/app.py
from shiny import App, render, ui, req
from matplotlib import pyplot as plt
from pydataset import data
import numpy as np
from sklearn.metrics import pairwise_distances

mtcars = data("mtcars")

# near_points(mtcars, {'x': 3.5, 'y': 15}, 'wt', 'mpg')
def near_points(df, position, xvar, yvar, threshold=20):
    points = df[[xvar, yvar]].copy().to_numpy()
    click = np.array([[position['x'], position['y']]])

    # Convert data into different scale
    # For now, put some logic
    # TO DO: revise with correct formula to convert it to pixel scale
    min_xvar = min([position['domain']['left'], position['domain']['right']])
    max_xvar = max([position['domain']['left'], position['domain']['right']])
    min_yvar = min([position['domain']['bottom'], position['domain']['top']])
    max_yvar = max([position['domain']['bottom'], position['domain']['top']])

    range_x = position['range']['right'] - position['range']['left']
    range_y = position['range']['top'] - position['range']['bottom']

    points[:,0] = position['range']['left'] + (points[:,0] - min_xvar) / (max_xvar - min_xvar) * range_x
    click[:,0] = position['range']['left'] + (click[:,0] - min_xvar) / (max_xvar - min_xvar) * range_x
    points[:,1] = position['range']['bottom'] + (points[:,1] - min_yvar) / (max_yvar - min_yvar) * range_y
    click[:,1] = position['range']['bottom'] + (click[:,1] - min_yvar) / (max_yvar - min_yvar) * range_y

    # Find points within threshold
    # For now, just list in a sequence of appearance in data
    # TO DO: sort by distance from closest to farthest
    near = pairwise_distances(points, click) < threshold
    return df[near]


app_ui = ui.page_fluid(
    ui.output_plot("plot", click=True),
    ui.output_table("data"),
)

def server(input, output, session):
    @render.plot
    def plot():
        res = plt.scatter(mtcars['wt'], mtcars['mpg'])
        return res

    @render.table
    def data():
        req(input.plot_click())
        return near_points(mtcars, input.plot_click(), xvar='wt', yvar='mpg')

app = App(app_ui, server)I could not find a function in Shiny for Python that is corresponding to nearPoints() in Shiny for R, so I implemented my own function near_points(). It does not behave exactly same to the R function, and I hope to find a better implementation.
In my experiment, the table frequently disappears immediately after appearing on a screen, and I do not know the exact reason.
Brushing
examples/action-graphics/brushing/app.py
from shiny import App, render, ui, req
from matplotlib import pyplot as plt
from pydataset import data

mtcars = data("mtcars")

# brushed_points(mtcars, {'xmin': 2, 'xmax': 3, 'ymin': 20, 'ymax': 30}, 'wt', 'mpg')
def brushed_points(df, position, xvar, yvar):
    in_region = ((df[xvar] > position['xmin'])
                 & (df[xvar] < position['xmax'])
                 & (df[yvar] > position['ymin'])
                 & (df[yvar] < position['ymax']))

    return df[in_region]


app_ui = ui.page_fluid(
    ui.output_plot("plot", brush=True),
    ui.output_table("data"),
)

def server(input, output, session):
    @render.plot
    def plot():
        res = plt.scatter(mtcars['wt'], mtcars['mpg'])
        return res

    @render.table
    def data():
        req(input.plot_brush())
        return brushed_points(mtcars, input.plot_brush(), xvar='wt', yvar='mpg')

app = App(app_ui, server)I could not find a function in Shiny for Python that is corresponding to brushedPoints() in Shiny for R, so I implemented my own function brushed_points().
Modifying the plot
Resizing point size in a scatter plot
examples/action-graphics/resizing/app.py
from shiny import App, ui, render, reactive
import pandas as pd
import numpy as np
from sklearn.metrics import pairwise_distances
from matplotlib import pyplot as plt

np.random.seed(1014)
df = pd.DataFrame({
    'x': np.random.normal(size=100),
    'y': np.random.normal(size=100)
})

def compute_distance(df, position, xvar, yvar):
    points = df[[xvar, yvar]].copy().to_numpy()
    click = np.array([[position['x'], position['y']]])

    # Compute distance
    dist = pairwise_distances(points, click)

    return dist

app_ui = ui.page_fluid(
    ui.output_plot("plot", click=True),
)

def server(input, output, session):
    dist = reactive.value([1 for _ in range(df.shape[0])])

    @reactive.effect
    @reactive.event(input.plot_click)
    def _():
        dist.set(compute_distance(df, input.plot_click(), xvar='x', yvar='y'))

    @render.plot
    def plot():
        size = np.minimum(np.power(dist.get(), 5), 300)
        res = plt.scatter(df['x'], df['y'], s=size)
        return res

app = App(app_ui, server)R example in Mastering Shiny book used R function nearPoints(), which is a built-in function in {shiny} R package, to compute distance between mouse click position and every each point in the plot in pixel scale. Because Shiny for Python does not have equivalent built-in function, I revised an example to compute the distance in original data scale and use a derived value from the distance as a size of each point.
Changing point color
from shiny import App, render, ui, reactive
from matplotlib import pyplot as plt
from pydataset import data
import pandas as pd

mtcars = data("mtcars")

# brushed_points(mtcars, {'xmin': 2, 'xmax': 3, 'ymin': 20, 'ymax': 30}, 'wt', 'mpg')
def brushed_points(df, position, xvar, yvar):
    in_region = ((df[xvar] > position['xmin'])
                 & (df[xvar] < position['xmax'])
                 & (df[yvar] > position['ymin'])
                 & (df[yvar] < position['ymax']))

    return df[in_region], in_region


app_ui = ui.page_fluid(
    ui.output_plot("plot", brush=True, dblclick=True),
)

def server(input, output, session):
    selected = reactive.value([False for _ in range(mtcars.shape[0])])

    @reactive.effect
    @reactive.event(input.plot_brush)
    def _():
        _, brushed = brushed_points(mtcars, input.plot_brush(), xvar='wt', yvar='mpg')
        selected.set(brushed | selected.get())

    @reactive.effect
    @reactive.event(input.plot_dblclick)
    def _():
        selected.set([False for _ in range(mtcars.shape[0])])

    @render.plot
    def plot():
        color = pd.Categorical(selected(), categories=[True, False])
        fig, ax = plt.subplots()
        res = ax.scatter(mtcars['wt'], mtcars['mpg'], c=color, label=color)
        # produce a legend with the unique colors from the scatter
        legend1 = ax.legend(*res.legend_elements(), loc="lower left", title="Classes")
        ax.add_artist(legend1)
        return res

app = App(app_ui, server)I slightly modified brushed_points() function that I used in a previous brushing examples, to return not only data points but also binary indicator whether each row in original data was selected or not in a current brushing event.
Dynamic height and width
Dynamically resizing plot size: height and width.
I could not exactly reproduce an example that exists in Mastering Shiny book for R. Let me show my code first, and let me explain more details.
examples/action-graphics/dynamic-height-width/app.py
from shiny import App, ui, render, reactive
import matplotlib.pyplot as plt
from numpy.random import normal

app_ui = ui.page_fluid(
    ui.input_slider("height", "height", min=100, max=500, value=250),
    ui.input_slider("width", "width", min=100, max=500, value=250),
    ui.output_ui("plot_container"),
)

def server(input, output, session):
    @render.plot
    def plot():
        return plt.scatter(normal(size=20), normal(size=20))

    @render.ui
    def plot_container():
        return ui.output_plot("plot",
                              height=f"{input.height()}px",
                              width=f"{input.width()}px")

app = App(app_ui, server)
I followed an approach that was proposed by Vincent Nijs. It uses dynamic UI, ui.output_ui() and render.ui(), which will be discussed in later chapters.
The noticable difference between this app and R app presented in Mastering Shiny book is that, this app will keep refreshing the plot and regenerate the data when changing a plot size, while the original R app that uses width and height arguments in renderPlot() does not regenerate the data and only changes the plot’s appearance.
This app will keep refreshing the plot and regenerate the data when changing a plot size.
@render.plot(width=input.width(), height=input.height()) returns an error message "_send_error_response: No current reactive context". @render.plot(width=input.width, height=input.height) returns an error message "TypeError: unsupported operand type(s) for /: 'Value' and 'float'". See relevant issue here.
Images
examples/action-graphics/puppy/app.py
from shiny import App, ui, render
from shiny.types import ImgData
import pandas as pd

puppies = pd.DataFrame({
    'breed': ["corgi", "labrador", "spaniel"],
    'id': ["eoqnr8ikwFE", "KCdYn0xu2fU", "TzjMd7i5WQI"],
    'author': ["alvannee", "shaneguymon", "_redo_"],
})

app_ui = ui.page_fluid(
    ui.input_select("id", "Pick a breed",
                    choices=dict(zip(puppies['id'], puppies['breed']))),
    ui.output_ui("source"),
    ui.output_image("photo"),
)

def server(input, output, session):
    @render.image
    def photo():
        img: ImgData = {"src": f"puppy-photos/{input.id()}.jpg",
                        "width": "500px", "height": "650px"}
        return img

    @render.ui
    def source():
        info = puppies[puppies['id'] == input.id()]
        res = ui.HTML(f"""<p>
            <a href='https://unsplash.com/photos/{info['id'].squeeze()}'>original</a> by
            <a href='https://unsplash.com/@{info['author'].squeeze()}'>{info['author'].squeeze()}</a>
            </p>""")

        return res

app = App(app_ui, server)
ImgData has additional attributes like alt and style. See here.
When I run the app on my interactive development environment, directory puppy-photos exists in a root directory of the project. It may not be an ideal configuration for deployment. An example on the Shiny for Python website set a directory of image path to be relative to a directory that app.py file exists.
from pathlib import Path

dir = Path(__file__).resolve().parent