Chapter 9 서포트 벡터 머신
9.1 개요
서포트 벡터 머신(suuport vector machine; 이하 SVM)은 기본적으로 두 범주를 갖는 객체들을 분류하는 방법이다. 물론 세 범주 이상의 경우로 확장이 가능하다.
9.2 필요 R package 설치
본 장에서 필요한 R 패키지들은 아래와 같다.
| package | version |
|---|---|
| tidyverse | 1.3.1 |
| e1071 | 1.7-7 |
| Matrix | 1.3-4 |
| quadprog | 1.5-8 |
9.3 선형 SVM - 분리 가능 경우
9.3.1 기본 R 스크립트
train_df <- tibble(
  x1 = c(5, 4, 7, 8, 3, 2, 6, 9, 5),
  x2 = c(7, 3, 8, 6, 6, 5, 6, 6, 4),
  class = c(1, -1, 1, 1, -1, -1, 1, 1, -1)
)

knitr::kable(train_df, booktabs = TRUE,
             align = c('r', 'r', 'r'),
caption = '선형분리가능 학습표본 데이터')| x1 | x2 | class |
|---|---|---|
| 5 | 7 | 1 |
| 4 | 3 | -1 |
| 7 | 8 | 1 |
| 8 | 6 | 1 |
| 3 | 6 | -1 |
| 2 | 5 | -1 |
| 6 | 6 | 1 |
| 9 | 6 | 1 |
| 5 | 4 | -1 |
Table 9.1와 같이 두 독립변수 x1, x2와 이분형 종속변수 class의 관측값으로 이루어진 9개의 학습표본을 train_df라는 data frame에 저장한다.
library(e1071)
svm_model <- svm(as.factor(class) ~ x1 + x2, data = train_df, kernel = "linear", scale = FALSE)
plot(svm_model, data = train_df, formula = x2 ~ x1, grid = 200)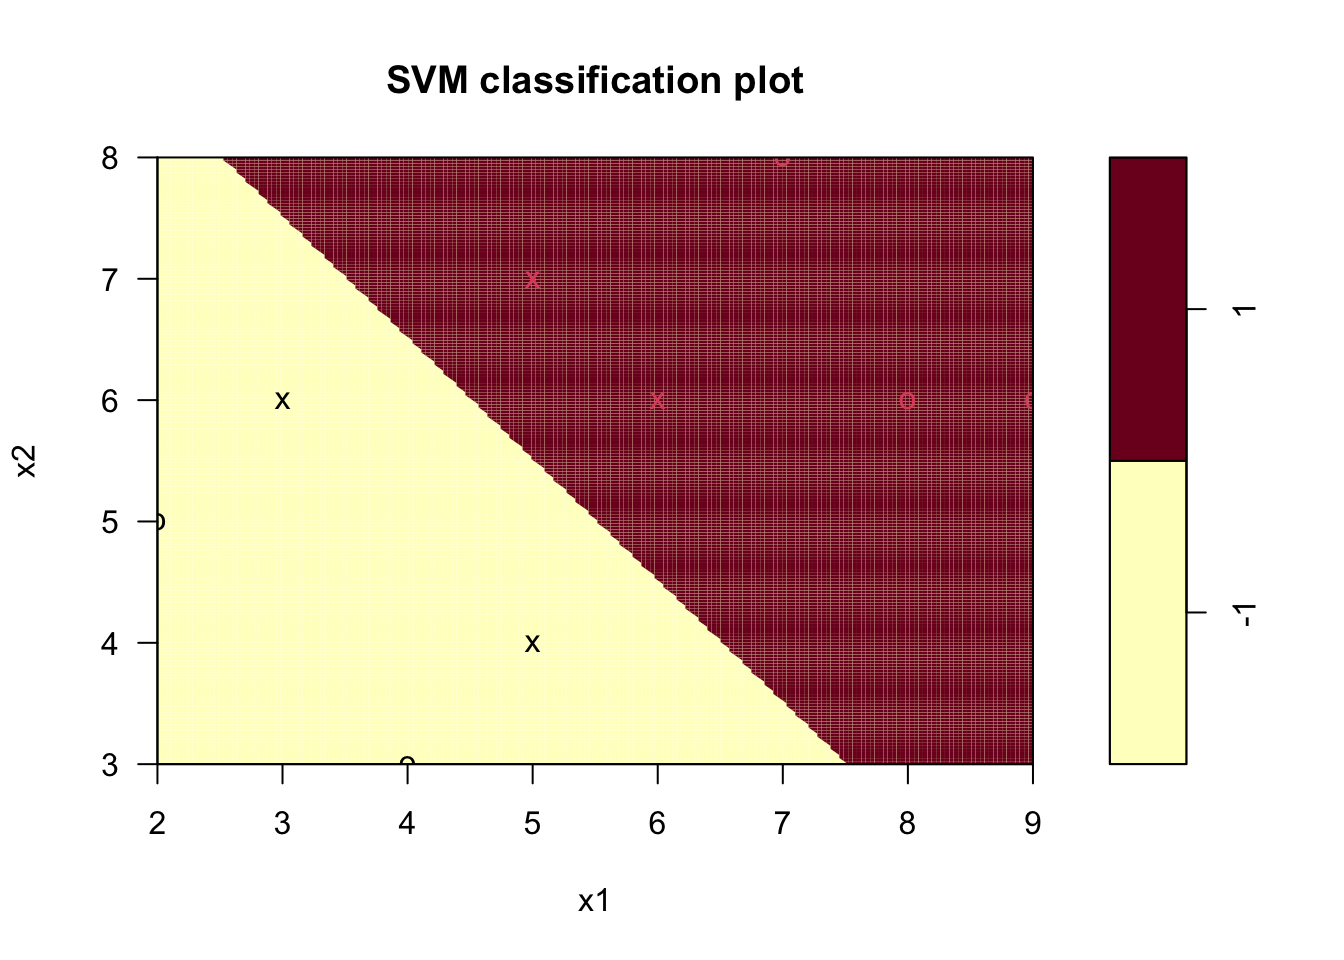
Figure 9.1: 선형 SVM 분리 하이퍼플레인
그림 9.1에서 각 객체의 기호는 서포트 벡터 여부(“X”이면 서포트 벡터), 각 객체의 색상은 범주값(검정 = -1, 빨강 = 1)을 나타내며, 분리 하이퍼플레인은 아래와 같다.
\[ 0.6666667 x_{1} + 0.6666667 x_{2} = 7 \]
9.3.2 기호 정의
본 장에서 사용될 수학적 기호는 아래와 같다.
- \(\mathbf{x} \in \mathbb{R}^p\): p차원 변수벡터
- \(y \in \{-1, 1\}\): 범주
- \(N\): 객체 수
- \((\mathbf{x}_i, y_i)\): \(i\)번째 객체의 변수벡터와 범주값
9.3.3 최적 하이퍼플레인
선형 SVM은 주어진 객체들의 두 범주를 완벽하게 분리하는 하이퍼플레인 중 각 범주의 서포트 벡터들로부터의 거리가 최대가 되는 하이퍼플레인을 찾는 문제로 귀착된다.
우선 아래와 같이 하이퍼플레인을 정의한다.
\[\begin{equation} \mathbf{w}^\top \mathbf{x} + b = 0 \tag{9.1} \end{equation}\]
여기서 \(\mathbf{w} \in \mathbb{R}^p\)와 \(b \in \mathbb{R}\)이 하이퍼플레인의 계수이다.
범주값이 1인 객체들 중 하이퍼플레인에서 가장 가까운 객체에 대해 다음과 같은 조건이 만족한다고 가정하자.
\[ H_1: \mathbf{w}^\top \mathbf{x} + b = 1 \]
또한 범주값이 -1인 객체들 중 하이퍼플레인에서 가장 가까운 객체에 대해 다음과 같은 조건이 만족한다고 가정하자.
\[ H_2: \mathbf{w}^\top \mathbf{x} + b = -1 \]
이 때 두 하이퍼플레인 \(H_1\)과 \(H_2\) 간의 거리(margin)는 \(2 / \lVert \mathbf{w} \rVert\)이다. 선형 SVM은 아래와 같이 \(H_1\)과 \(H_2\) 간의 거리를 최대로 하는 최적화 문제가 된다.
\[\begin{equation*} \begin{split} \max \text{ } & \frac{2}{\mathbf{w}^\top \mathbf{w}}\\ \text{s.t.}& \\ & \mathbf{w}^\top \mathbf{x}_i + b \ge 1 \text{ for } y_i = 1\\ & \mathbf{w}^\top \mathbf{x}_i + b \le -1 \text{ for } y_i = -1 \end{split} \end{equation*}\]
이를 간략히 정리하면
\[\begin{equation*} \begin{split} \min \text{ } & \frac{\mathbf{w}^\top \mathbf{w}}{2}\\ \text{s.t.}& \\ & y_i \left( \mathbf{w}^\top \mathbf{x}_i + b \right) \ge 1 \end{split} \end{equation*}\]
과 같이 정리할 수 있으며, 각 객체 \(i\)에 대한 제약조건에 라그랑지 계수(Lagrange multiplier) \(\alpha_i \ge 0\)를 도입하여 라그랑지 함수를 유도하면 식 (9.2)과 같은 최적화 문제가 된다. 이를 원문제(primal problem)라 하자.
\[\begin{equation} \begin{split} \min \text{ } & L_P = \frac{1}{2} \mathbf{w}^\top \mathbf{w} + \sum_{i = 1}^{N} \alpha_i \left[ y_i \left( \mathbf{w}^\top \mathbf{x}_i + b \right) - 1 \right]\\ \text{s.t. } & \alpha_i \ge 0, \text{ } i = 1, \cdots, N \end{split} \tag{9.2} \end{equation}\]
원문제 식 (9.2)에 대한 울프쌍대문제(Wolfe dual problem)는 아래 식 (9.3)과 같이 도출된다. 보다 자세한 내용은 교재(전치혁 2012) 참고.
\[\begin{equation} \begin{split} \max \text{ } & L_D = \sum_{i = 1}^{N} \alpha_i - \frac{1}{2} \sum_{i = 1}^{N} \sum_{j = 1}^{N} \alpha_i \alpha_j y_i y_j \mathbf{x}_i^\top \mathbf{x}_j\\ \text{s.t. } &\\ & \sum_{i = 1}^{N} \alpha_i y_i = 0\\ & \alpha_i \ge 0, \text{ } i = 1, \cdots, N \end{split} \tag{9.3} \end{equation}\]
식 (9.3)은 이차계획(quadratic programming) 문제로, 각종 소프트웨어와 알고리즘을 이용하여 구할 수 있다. 본 장에서는 quadprog 패키지를 이용하여 해를 구하기로 한다. 이는 실제로 e1071의 svm 함수 호출 시 사용하는 방법은 아니며, 실제 svm 함수가 호출하는 알고리즘은 다음 장에서 다시 설명하기로 한다.
quadprog의 solve.QP 함수는 아래와 같은 형태로 formulation된 문제(Goldfarb and Idnani 1983)에 대한 최적해를 구한다.
\[\begin{equation} \begin{split} \min \text{ } & -\mathbf{d}^{\top}\boldsymbol{\alpha} + \frac{1}{2} \boldsymbol{\alpha}^{\top}\mathbf{D}\boldsymbol{\alpha}\\ \text{s.t. } & \mathbf{A}^{\top}\boldsymbol{\alpha} \ge \mathbf{b}_0 \end{split} \tag{9.4} \end{equation}\]
식 (9.4)과 식 (9.3)이 동일한 문제를 나타내도록 아래와 같이 목적함수에 필요한 벡터 및 행렬을 정의한다.
\[\begin{eqnarray*} \mathbf{d} &=& \mathbf{1}_{N \times 1}\\ \mathbf{D} &=& \mathbf{y}\mathbf{y}^{\top}\mathbf{X}\mathbf{X}^{\top} \end{eqnarray*}\] where \[\begin{eqnarray*} \mathbf{y} &=& \left[ \begin{array}{c c c c} y_1 & y_2 & \cdots & y_N \end{array} \right]^\top\\ \mathbf{X} &=& \left[ \begin{array}{c c c c} \mathbf{x}_1 & \mathbf{x}_2 & \cdots & \mathbf{x}_N \end{array} \right]^{\top} \end{eqnarray*}\]
N <- dim(train_df)[1]
X <- train_df[c('x1', 'x2')] %>% as.matrix()
y <- train_df[['class']] %>% as.numeric()

d <- rep(1, N)
D <- (y %*% t(y)) * (X %*% t(X))
여기에서 행렬 \(\mathbf{D}\)의 determinant 값은 0으로, Goldfarb and Idnani (1983) 가 가정하는 symmetric positive definite matrix 조건에 위배되어 solve.QP 함수 실행 시 오류가 발생한다. 이를 방지하기 위해 아래 예에서는 Matrix 패키지의 nearPD함수를 이용하여 행렬 \(\mathbf{D}\)와 근사한 symmetric positive definite matrix를 아래와 같이 찾는다.
D_pd <- Matrix::nearPD(D, doSym = T)$mat %>% as.matrix()식 (9.4)의 제약식은 모두 inequality 형태로, 식 (9.3)의 equality constraint \(\sum_{i = 1}^{N} \alpha_i y_i = 0\)를 표현하기 위해서 두 개의 제약식 \(\sum_{i = 1}^{N} \alpha_i y_i \ge 0\)와 \(\sum_{i = 1}^{N} - \alpha_i y_i \ge 0\)를 생성한다.
\[\begin{equation*} \mathbf{A}^\top = \left[ \begin{array}{c c c c} y_1 & y_2 & \cdots & y_N\\ -y_1 & -y_2 & \cdots & -y_N\\ 1 & 0 & \cdots & 0\\ 0 & 1 & \cdots & 0\\ \cdots & \cdots & \cdots & \cdots \\ 0 & 0 & \cdots & 1 \end{array} \right], \mathbf{b}_0 = \left[ \begin{array}{c} 0 \\ 0 \\ 0 \\ 0 \\ \cdots \\ 0 \end{array} \right] \end{equation*}\]
A <- cbind(
  y,
  -y,
  diag(N)
)
b_zero <- rep(0, 2 + N)
이제 위에서 구한 행렬과 벡터들을 solve.QP 함수에 입력하여 최적해를 구한다.
res <- quadprog::solve.QP(D_pd, d, A, b_zero)
alpha_sol <- res$solution
obj_val <- -res$value| variable | solution |
|---|---|
| alpha_1 | 0.2234 |
| alpha_2 | 0.0000 |
| alpha_3 | 0.0000 |
| alpha_4 | 0.0000 |
| alpha_5 | 0.2228 |
| alpha_6 | 0.0000 |
| alpha_7 | 0.2210 |
| alpha_8 | 0.0000 |
| alpha_9 | 0.2216 |
표 9.2의 결과는 교재(전치혁 2012)에 나타난 최적해와는 다소 차이가 있으나, 결과적으로 목적함수값은 0.4444로 동일하다.
위의 과정으로 최적해 \(\alpha_{i}^{*}\)를 구한 뒤, 아래와 같이 분리 하이퍼플레인의 계수를 결정할 수 있다.
\[\begin{eqnarray*} \mathbf{w} &=& \sum_{i = 1}^{N} \alpha_{i}^{*} y_{i} \mathbf{x}_{i}\\ b &=& \sum_{i: \alpha_{i}^{*} > 0} \frac{1 - y_{i} \mathbf{w}^{\top} \mathbf{x}_{i}}{y_{i}} \left/ \sum_{i: \alpha_{i}^{*} > 0} 1 \right. \end{eqnarray*}\]
w <- colSums(alpha_sol * y * X)
print(w)
## x1 x2
## 0.6666658 0.6666657sv_ind <- which(round(alpha_sol, digits = 4) > 0)
b <- mean((1 - y[sv_ind] * (X[sv_ind, ] %*% w)) / y[sv_ind])
print(b)## [1] -6.99999위 결과와 같이, 분리 하이퍼플레인은 교재와 동일하게 얻어진다.
9.4 선형 SVM - 분리 불가능 경우
본 장에서는 학습표본 내의 두 범주가 어떠한 선형 하이퍼플레인으로도 완전하게 분리되지 않아 식 (9.2)이 해를 갖지 못하는 경우에 대한 문제를 다룬다.
9.4.1 기본 R 스크립트
앞 장에서 사용한 학습표본에 아래와 같이 하나의 객체를 추가하여 전체 학습표본이 선형 하이퍼플레인으로 분리될 수 없도록 하자.
inseparable_train_df <- bind_rows(train_df,
                                  tibble(x1 = 7, x2 = 6, class = -1))

knitr::kable(inseparable_train_df, booktabs = TRUE,
             align = c('r', 'r', 'r'),
caption = '선형분리불가능 학습표본 데이터')| x1 | x2 | class |
|---|---|---|
| 5 | 7 | 1 |
| 4 | 3 | -1 |
| 7 | 8 | 1 |
| 8 | 6 | 1 |
| 3 | 6 | -1 |
| 2 | 5 | -1 |
| 6 | 6 | 1 |
| 9 | 6 | 1 |
| 5 | 4 | -1 |
| 7 | 6 | -1 |
library(e1071)
svm_model <- svm(as.factor(class) ~ x1 + x2, data = inseparable_train_df,
                 kernel = "linear", cost = 1, scale = FALSE)
plot(svm_model, data = inseparable_train_df, formula = x2 ~ x1, grid = 200)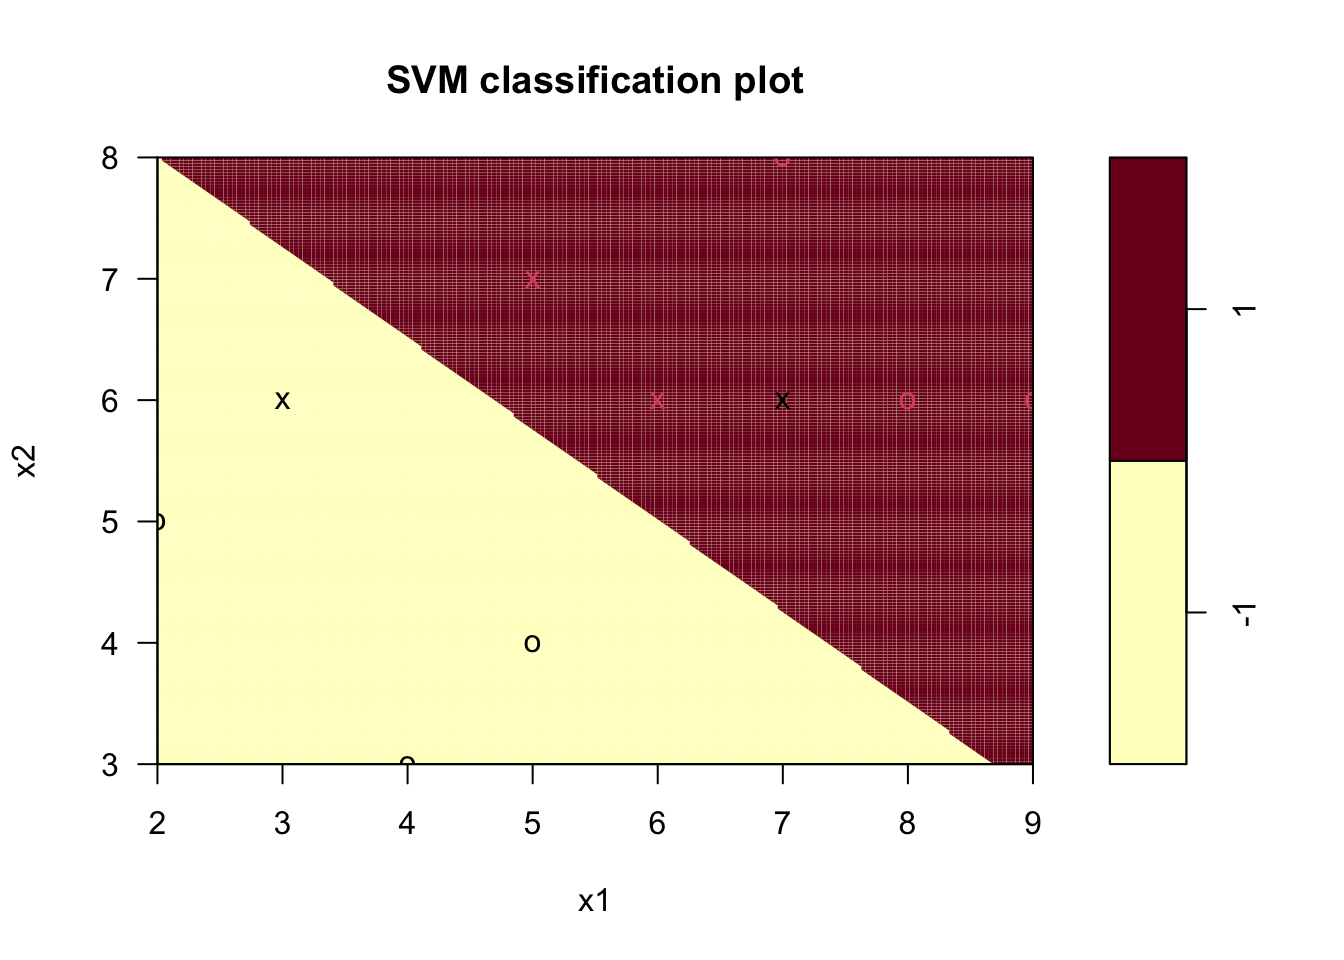
Figure 9.2: 선형 SVM 분리 불가능 경우의 하이퍼플레인
Figure 9.2에서 보이듯, 하나의 검정 객체(범주 = -1)가 범주 1로 분류되는 영역에 존재하여 오분류가 발생한다. 이처럼 선형 하이퍼플레인으로 두 범주 학습표본의 분리가 불가능한 경우, 오분류 학습표본에 대한 페널티를 적용하여 최적 분리 하이퍼플레인을 도출하게 된다. 위 예에서의 최적 하이퍼플레인은 아래와 같다.
\[ 0.6 x_{1} + 0.8 x_{2} = 7.6 \]
9.4.2 최적 하이퍼플레인
여유변수(slack variable) \(\xi_i\) 를 각 학습객체 \(i = 1, \cdots, N\)에 대해 아래와 같이 정의한다.
\[\begin{equation*} \xi_i = \max \left\{ 0, 1 - y_i (\mathbf{w}^\top \mathbf{x}_i + b) \right\} \end{equation*}\]
이는 객체가 자신의 범주의 서포트 벡터를 지나는 하이퍼플레인(범주 1인 경우 \(H_1\), 범주 -1인 경우 \(H_2\))으로 부터 다른 범주 방향으로 떨어진 거리를 나타낸다. 이 여유변수 \(\xi_i\)에 단위당 페널티 단가 \(C\)를 부여하여 아래와 같은 최적화 문제를 정의한다.
\[\begin{equation*} \begin{split} \min \text{ } & \frac{\mathbf{w}^\top \mathbf{w}}{2} + C \sum_{i = 1}^{N} \xi_i \\ \text{s.t.}& \\ & y_i \left( \mathbf{w}^\top \mathbf{x}_i + b \right) \ge 1 - \xi_i, \text{ } i = 1, \cdots, N \\ & \xi \ge 0, \text{ } i = 1, \cdots, N \end{split} \end{equation*}\]
이에 대한 울프쌍대문제를 앞 9.3.3장과 같은 과정으로 도출하면 아래 식 (9.5)와 같다.
\[\begin{equation} \begin{split} \max \text{ } & L_D = \sum_{i = 1}^{N} \alpha_i - \frac{1}{2} \sum_{i = 1}^{N} \sum_{j = 1}^{N} \alpha_i \alpha_j y_i y_j \mathbf{x}_i^\top \mathbf{x}_j\\ \text{s.t. } &\\ & \sum_{i = 1}^{N} \alpha_i y_i = 0\\ & 0 \le \alpha_i \le C, \text{ } i = 1, \cdots, N \end{split} \tag{9.5} \end{equation}\]
이는 분리 가능 경우의 식 (9.3)에 변수 \(\alpha_i\)에 대한 상한값 \(C\)의 제약이 추가된 문제로, 이는 e1071 패키지의 svm 함수가 기본 방법으로 사용하는 LIBSVM 라이브러리(Chang and Lin 2011)의 \(C\)-support vector classification(\(C\)-SVC)이 사용하는 문제식이며, LIBSVM 라이브러리는 특정 알고리즘(Fan, Chen, and Lin 2005)을 이용하여 해를 제공한다.
아래 svm 함수의 입력 변수에서 type = "C-classification"은 식 (9.3)를 최적화하겠다는 것을 나타내며, cost = 1은 페널티 단가 \(C\)의 값을 1로 설정하겠다는 것을 나타낸다.
svm_model <- svm(as.factor(class) ~ x1 + x2, data = inseparable_train_df,
                 kernel = "linear", scale = FALSE,
                 type = "C-classification", cost = 1)
위 결과 모델 객체 svm_model의 원소 중 index는 학습표본 중 서포트 벡터에 해당하는 인덱스 \(i\)를 나타내며, coefs는 각 서포트 벡터의 \(\alpha_i y_i\) 값을 나타낸다. 따라서, coefs를 각 서포트 벡터의 범주값 \(y_i\)로 나누면 식 (9.5)의 최적해를 아래와 같이 볼 수 있다.
N <- dim(inseparable_train_df)[1]
X <- inseparable_train_df[c('x1', 'x2')] %>% as.matrix()
y <- inseparable_train_df[['class']] %>% as.numeric()

sv_ind <- svm_model$index
alpha_sol <- vector("numeric", N)
alpha_sol[sv_ind] <- drop(svm_model$coefs[, 1]) / y[sv_ind]| variable | solution |
|---|---|
| alpha_1 | 0.8 |
| alpha_2 | 0.0 |
| alpha_3 | 0.0 |
| alpha_4 | 0.0 |
| alpha_5 | 0.8 |
| alpha_6 | 0.0 |
| alpha_7 | 1.0 |
| alpha_8 | 0.0 |
| alpha_9 | 0.0 |
| alpha_10 | 1.0 |
하이퍼플레인의 계수 \(\mathbf{w}\)는 분리 가능의 경우와 동일하게 구할 수 있다.
\[\begin{equation*} \mathbf{w} = \sum_{i = 1}^{N} \alpha_{i}^{*} y_{i} \mathbf{x}_{i} \end{equation*}\]
w <- colSums(alpha_sol * y * X)
print(w)
## x1 x2
## 0.6 0.8상수 \(b\)는 아래와 같이 \(0 < \alpha_{i}^{*} < C\)인 객체들을 이용해 산출할 수 있다.
\[\begin{equation*} b = \sum_{i: 0 < \alpha_{i}^{*} < C} \frac{1 - y_{i} \mathbf{w}^{\top} \mathbf{x}_{i}}{y_{i}} \left/ \sum_{i: 0 < \alpha_{i}^{*} < C} 1 \right. \end{equation*}\]
ind <- sv_ind[alpha_sol[sv_ind] < svm_model$cost]
b <- mean((1 - y[ind] * (X[ind, ] %*% w)) / y[ind])
print(b)
## [1] -7.6위와 같은 하이퍼플레인의 계수 \(\mathbf{w}\)와 상수 \(b\)값은 svm 객체에 원소들을 이용하여 보다 쉽게 확인할 수 있다.
w <- t(svm_model$coefs) %*% svm_model$SV
print(w)
## x1 x2
## [1,] 0.6 0.8b <- -svm_model$rho
print(b)## [1] -7.6선형 하이퍼플레인으로 분리 불가능한 경우, 페널티 단가 \(C\)의 값에 따라 도출되는 분리 하이퍼플레인이 달라진다. \(C\)의 값이 1, 5, 100일 때의 하이퍼플레인을 비교해보자.
svm_models <- lapply(c(1, 5, 100), function(C)
  svm(as.factor(class) ~ x1 + x2, data = inseparable_train_df,
      kernel = "linear", scale = FALSE,
      type = "C-classification", cost = C))

getHyperplane <- function(model) {
  list(C = model$cost,
       w = paste(round(t(model$coefs) %*% model$SV, digits = 2), collapse = ", "),
       b = -round(model$rho, digits = 2),
       sv = paste(model$index, collapse = ", "),
       misclassified = paste(which(model$fitted != as.factor(inseparable_train_df$class)), collapse = ", "))
}

svm_summary <- lapply(svm_models, getHyperplane) %>% bind_rows()| 페널티 단가 \(C\) | \((w_1, w_2)\) | \(b\) | 서포트 벡터 객체 | 오분류 객체 |
|---|---|---|---|---|
| 1 | 0.6, 0.8 | -7.6 | 1, 7, 5, 10 | 10 |
| 5 | 0.4, 1.2 | -9.4 | 1, 4, 7, 5, 10 | 10 |
| 100 | 0.4, 1.2 | -9.4 | 1, 4, 7, 5, 10 | 10 |
Table 9.5에서 보이는 바와 같이, 페널티 단가 \(C\)의 값이 1과 5일 때 분리 하이퍼플레인이 변하는 것을 볼 수 있다. \(C\)값이 5와 100일 때의 분리 하이퍼플레인은 거의 동일하다.
plot(svm_models[[2]], data = inseparable_train_df, formula = x2 ~ x1, grid = 200)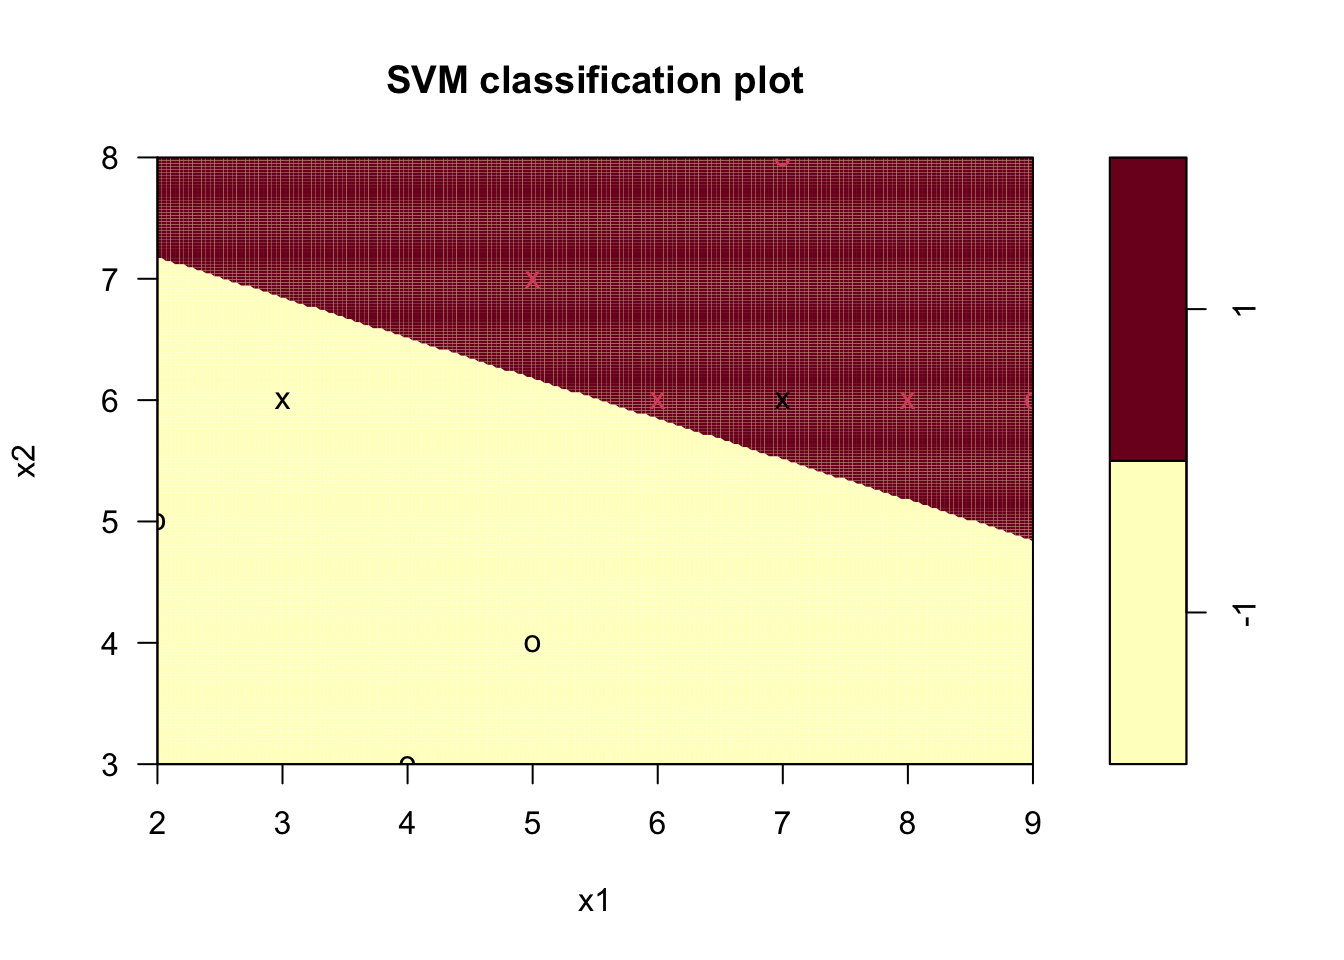
Figure 9.3: 선형 SVM 분리 불가능 경우의 하이퍼플레인 (\(C = 5\))
Figure 9.3의 하이퍼플레인(\(C = 5\)인 경우)은 Figure 9.2의 하이퍼플레인(\(C = 1\)인 경우)보다 오분류 객체에 가깝게 위치함을 확인할 수 있다.
9.5 비선형 SVM
본 장에서는 선형으로 분리 성능이 좋지 않은 경우에 대해 원 입력변수에 대해 비선형인 하이퍼플레인을 찾는 문제를 다룬다. 이는 원 입력변수에 대해 비선형인 기저함수 공간으로 객체를 이동시킨 후 해당 공간에서 선형 분리 하이퍼플레인을 찾는 과정이다.
9.5.1 기본 R 스크립트
nonlinear_train_df <- tibble(
  x1 = c(5, 4, 7, 8, 3, 2, 6, 9, 5),
  x2 = c(7, 3, 8, 6, 6, 5, 6, 6, 4),
  class = c(1, -1, -1, -1, 1, 1, 1, -1, -1)
)

knitr::kable(nonlinear_train_df, booktabs = TRUE,
             align = c('r', 'r', 'r'),
caption = '비선형 SVM 학습표본 데이터')| x1 | x2 | class |
|---|---|---|
| 5 | 7 | 1 |
| 4 | 3 | -1 |
| 7 | 8 | -1 |
| 8 | 6 | -1 |
| 3 | 6 | 1 |
| 2 | 5 | 1 |
| 6 | 6 | 1 |
| 9 | 6 | -1 |
| 5 | 4 | -1 |
library(e1071)
svm_model <- svm(as.factor(class) ~ x1 + x2, data = nonlinear_train_df,
                 kernel = "polynomial", coef0 = 1, gamma = 1, degree = 2,
                 cost = 5, scale = FALSE)
plot(svm_model, data = nonlinear_train_df, formula = x2 ~ x1, grid = 200)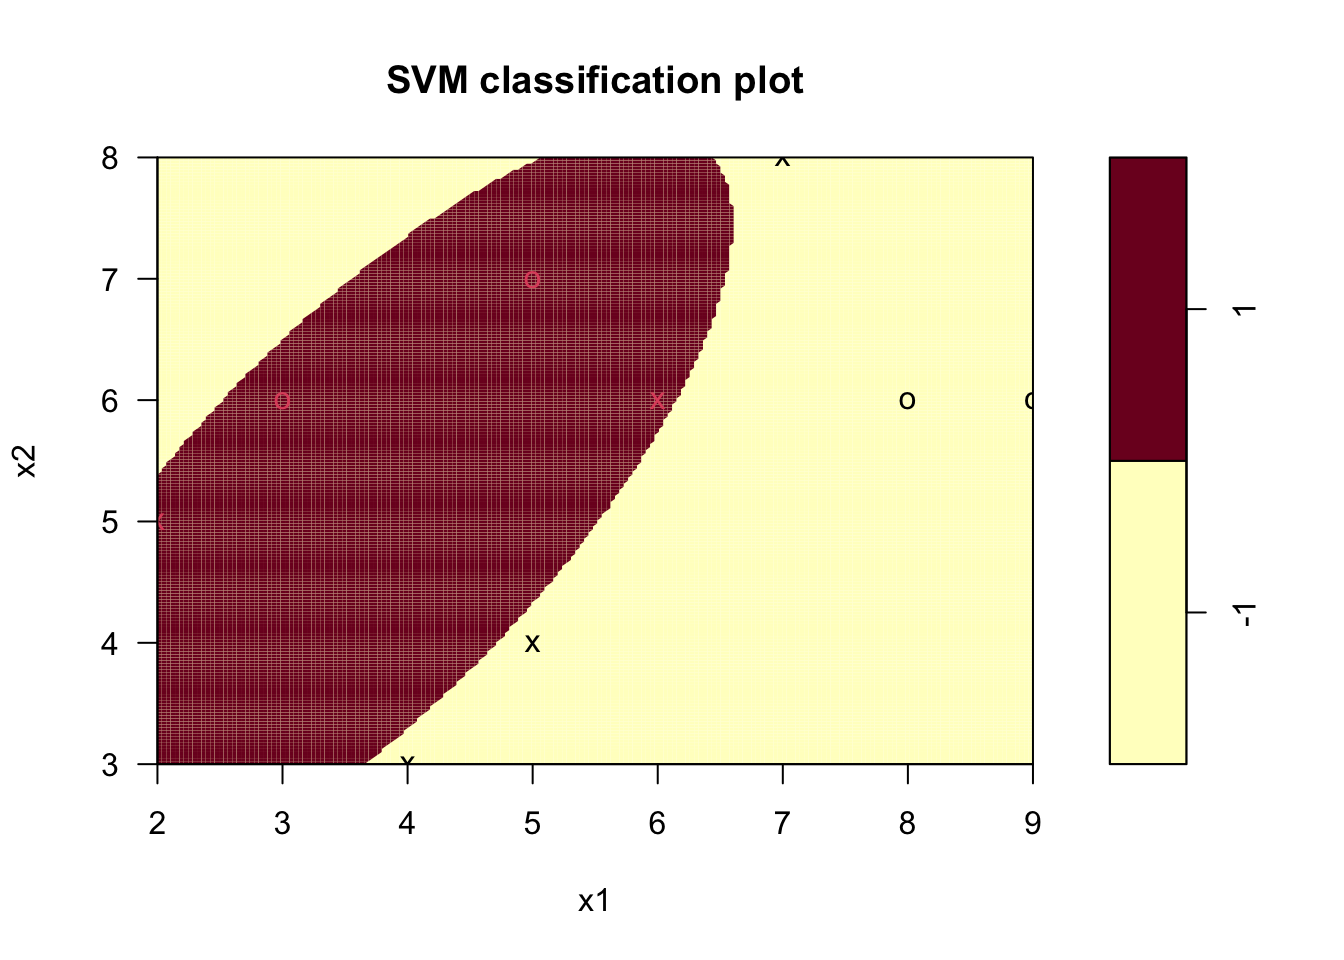
Figure 9.4: 비선형 SVM 하이퍼플레인
9.5.2 최적 하이퍼플레인
식 (9.1)을 일반화한 다음과 같은 하이퍼플레인을 고려하자.
\[\begin{equation} f(\mathbf{x}) = \Phi(\mathbf{x})^\top \mathbf{w} + b \tag{9.6} \end{equation}\]
여기서 벡터함수 \(\Phi: \mathbb{R}^p \rightarrow \mathbb{R}^m\)는 \(\mathbf{x}\)에 대한 새로운 특징(feature)을 추출하는 변환함수라 할 수 있는데, 통상 추출되는 특징의 차원 \(m\)이 원 변수 \(\mathbf{x}\)의 차원 \(p\)보다 높다. 이를 \(\mathbf{x}\)의 기저함수(basis function)라 부르며, 하이퍼플레인 계수 또한 \(m\)차원의 벡터가 된다 (\(\mathbf{w} \in \mathbb{R}^m\)). 이 때, 비선형 SVM 문제는 선형 SVM 문제 식 (9.5)에서 변수를 기저변수로 치환한 형태로 아래 식 (9.7)과 같이 나타낼 수 있다.
\[\begin{equation} \begin{split} \max \text{ } & L_D = \sum_{i = 1}^{N} \alpha_i - \frac{1}{2} \sum_{i = 1}^{N} \sum_{j = 1}^{N} \alpha_i \alpha_j y_i y_j \Phi(\mathbf{x}_i)^\top \Phi(\mathbf{x}_j)\\ \text{s.t. } &\\ & \sum_{i = 1}^{N} \alpha_i y_i = 0\\ & 0 \le \alpha_i \le C, \text{ } i = 1, \cdots, N \end{split} \tag{9.7} \end{equation}\]
식 (9.7)의 목적함수에서 기저함수의 내적 \(\Phi(\mathbf{x}_i)^\top \Phi(\mathbf{x}_j)\)을 아래와 같이 커널함수(kernel function)로 나타낼 수 있으며, 이는 두 객체 \(\mathbf{x}_i, \mathbf{x}_j\)간의 일종의 유사성 척도(similarity measure)로 해석될 수 있다.
\[\begin{equation*} K(\mathbf{x}_i, \mathbf{x}_j) = \Phi(\mathbf{x}_i)^\top \Phi(\mathbf{x}_j) \end{equation*}\]
널리 사용되는 커널함수로는 아래와 같은 함수들이 있다.
\[\begin{eqnarray*} \text{Gaussian RBF:} & & K(\mathbf{x}_i, \mathbf{x}_j) = \exp \left( \frac{- \left\lVert \mathbf{x}_i - \mathbf{x}_j \right\rVert^2}{2 \sigma^2} \right)\\ \text{$r$-th order polynomial:} & & K(\mathbf{x}_i, \mathbf{x}_j) = \left( \mathbf{x}_i^\top \mathbf{x}_j + 1 \right)^r \\ \text{Sigmoid:} & & K(\mathbf{x}_i, \mathbf{x}_j) = \tanh \left(\kappa \mathbf{x}_i^\top \mathbf{x}_j - \delta \right) \end{eqnarray*}\]
커널함수를 이용하여 분리 하이퍼플레인을 찾기 위한 식을 아래와 같이 나타낸다.
\[\begin{equation} \begin{split} \max \text{ } & L_D = \sum_{i = 1}^{N} \alpha_i - \frac{1}{2} \sum_{i = 1}^{N} \sum_{j = 1}^{N} \alpha_i \alpha_j y_i y_j k_{ij}\\ \text{s.t. } &\\ & \sum_{i = 1}^{N} \alpha_i y_i = 0\\ & 0 \le \alpha_i \le C, \text{ } i = 1, \cdots, N \end{split} \tag{9.8} \end{equation}\]
이 때 \(k_{ij}\)는 \(K(\mathbf{x}_i, \mathbf{x}_j)\)를 나타낸다. 식 (9.8)의 최적해 \(\boldsymbol\alpha^*\)는 선형 SVM과 마찬가지로 이차계획(quadratic programming) 소프트웨어/알고리즘을 이용하여 구할 수 있다.
Table 9.6의 학습데이터에 대해 e1071 패키지의 svm 함수를 이용하여 이차 다항 커널에 기반한 분리 하이퍼플레인을 구해보자. svm 함수에 파라미터값 kernel = "polynomial"를 설정함으로써 다항 커널을 사용할 수 있다. svm 함수의 다항 커널은 위에서 설명된 것보다 일반화된 형태로 아래와 같이 정의된다.
\[\begin{equation*} K(\mathbf{x}_i, \mathbf{x}_j) = \left( \gamma \mathbf{x}_i^\top \mathbf{x}_j + \beta_0 \right)^r \end{equation*}\]
위 커널함수의 파라미터 \(\gamma, \beta_0, r\)은 svm 함수에 파라미터 gamma, coef0, degree로 각각 정의된다. 따라서 이차 커널
\[\begin{equation*} K(\mathbf{x}_i, \mathbf{x}_j) = \left( \mathbf{x}_i^\top \mathbf{x}_j + 1 \right)^2 \end{equation*}\]
에 기반한 SVM을 학습하기 위해서 아래와 같이 svm 함수를 호출한다.
svm_model <- svm(as.factor(class) ~ x1 + x2, data = nonlinear_train_df,
                 kernel = "polynomial", coef0 = 1, gamma = 1, degree = 2,
                 scale = FALSE)
위 함수 호출 결과 서포트 벡터 객체는 1, 7, 2, 3, 9이다.
비선형 SVM의 분리 하이퍼플레인 또한 페널티 단가 \(C\)의 값에 따라 달라진다. 선형 SVM의 경우와 같이 \(C = 1, 5, 100\)에 대해 각각 비선형 SVM을 구해보자.
svm_models <- lapply(
  c(1, 5, 100),
  function(C)
    svm(as.factor(class) ~ x1 + x2, data = nonlinear_train_df,
        kernel = "polynomial", coef0 = 1, gamma = 1, degree = 2,
        cost = C, scale = FALSE)
)

getSummary <- function(model) {
  list(C = model$cost,
       sv = paste(model$index, collapse = ", "),
       misclassified = paste(which(model$fitted != as.factor(nonlinear_train_df$class)), collapse = ", "))
}

svm_summary <- lapply(svm_models, getSummary) %>% bind_rows()| 페널티 단가 \(C\) | 서포트 벡터 객체 | 오분류 객체 |
|---|---|---|
| 1 | 1, 7, 2, 3, 9 | 7 |
| 5 | 6, 7, 2, 3, 9 | |
| 100 | 6, 7, 2, 3, 9 |
9.6 R패키지 내 SVM
9.6.1 커널함수
앞 장에서는 선형 커널과 다항 커널함수의 예를 살펴보았다. 본 장에서는 가우시안 커널 및 시그모이드 커널을 사용하는 법을 살펴보자.
가우시안 커널의 경우
\[\begin{equation*} K(\mathbf{x}_i, \mathbf{x}_j) = \exp \left( -\gamma \left\lVert \mathbf{x}_i - \mathbf{x}_j \right\rVert^2 \right) \end{equation*}\]
과 같이 \(\gamma\) 파라미터를 이용하여 함수를 정의하며, svm 함수에 gamma 파라미터값을 통해 설정할 수 있다.
svm_model <- svm(as.factor(class) ~ x1 + x2, data = nonlinear_train_df,
                 kernel = "radial", gamma = 1,
                 cost = 5, scale = FALSE)
plot(svm_model, data = nonlinear_train_df, formula = x2 ~ x1, grid = 200)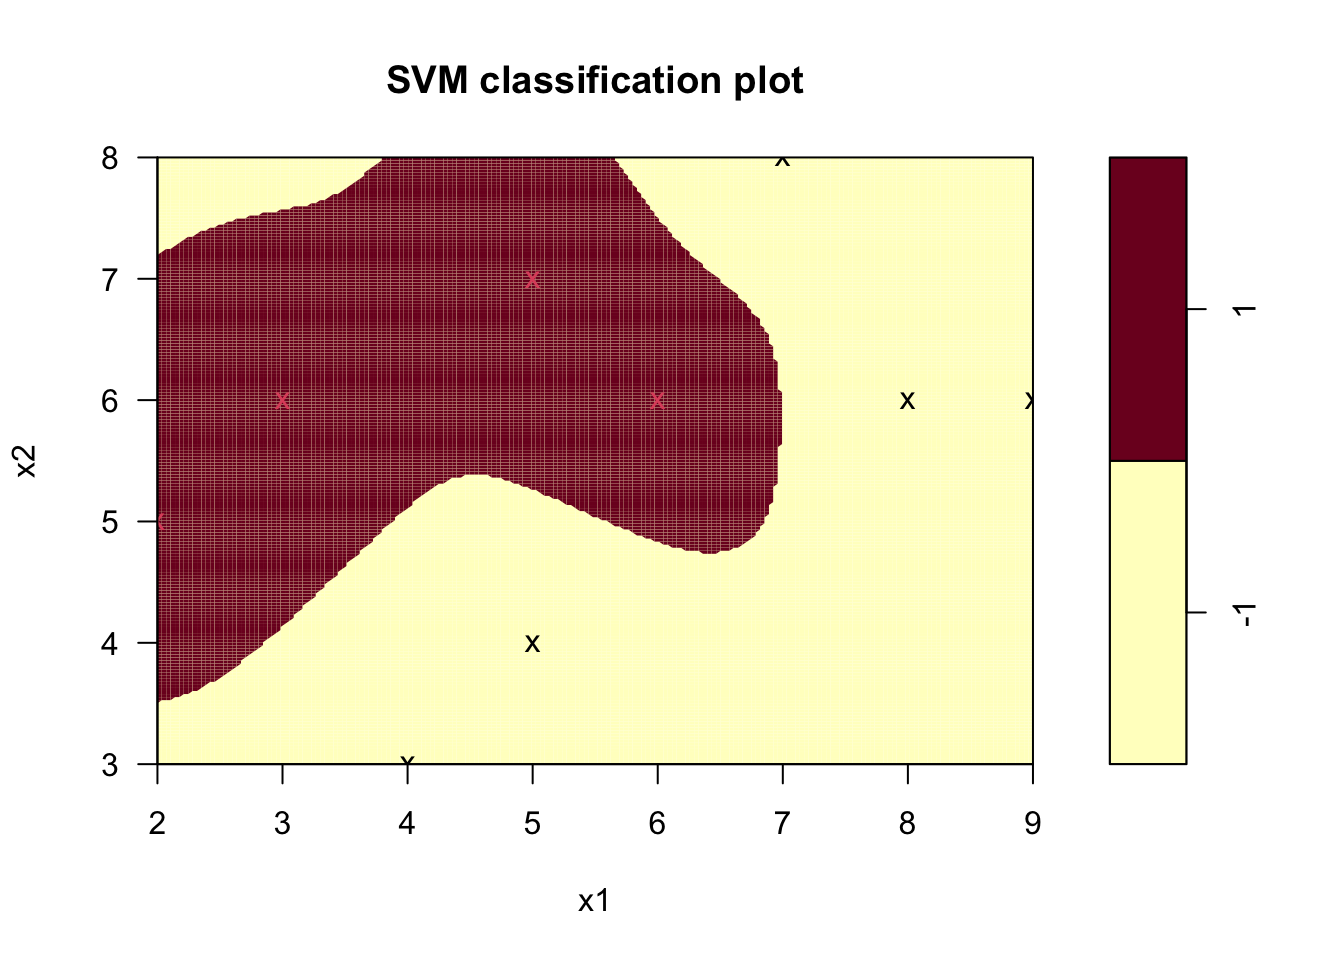
Figure 9.5: 가우시안 커널을 이용한 비선형 SVM 하이퍼플레인
시그모이드 커널의 경우
\[\begin{equation*} K(\mathbf{x}_i, \mathbf{x}_j) = \tanh \left(\gamma \mathbf{x}_i^\top \mathbf{x}_j + \beta_0 \right) \end{equation*}\]
와 같이 두 파라미터 \(\gamma, \beta_0\)의 값에 대응하는 svm 함수의 파라미터 gamma, coef0 값을 통해 설정할 수 있다.
svm_model <- svm(as.factor(class) ~ x1 + x2, data = nonlinear_train_df,
                 kernel = "sigmoid", gamma = 0.01, coef0 = -1,
                 cost = 5, scale = FALSE)
plot(svm_model, data = nonlinear_train_df, formula = x2 ~ x1, grid = 200)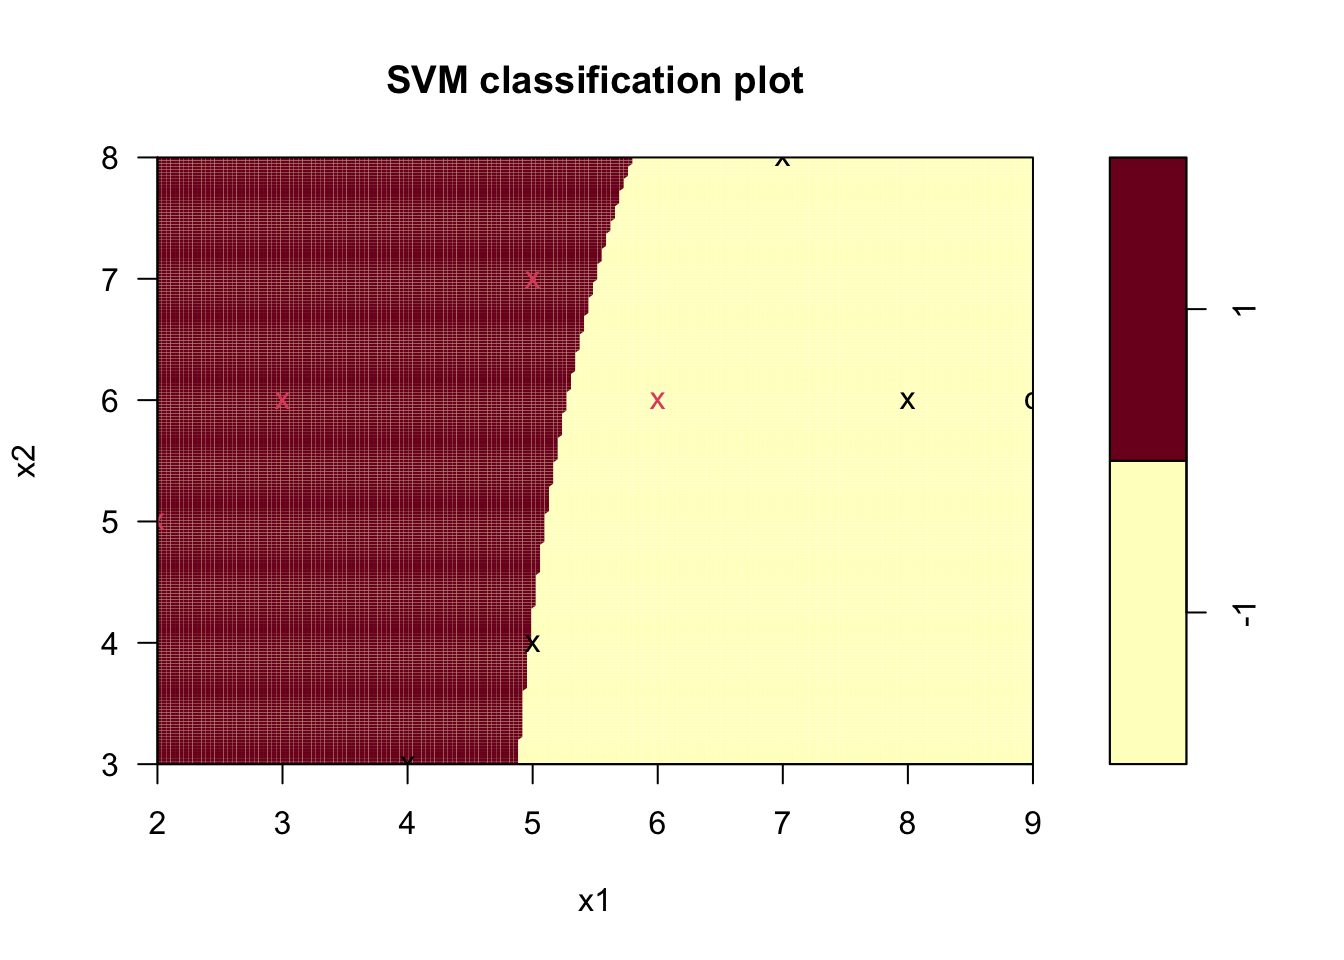
Figure 9.6: 시그모이드 커널을 이용한 비선형 SVM 하이퍼플레인
커널 함수의 종류 kernel, 커널 함수의 파라미터 gamma, coef0, degree, 페널티 단가 cost등의 svm 함수 파라미터는 학습 표본과는 별도의 테스트 데이터에 대해 오분류율을 최소화하는 값을 선택하는 것이 일반적이다.
9.6.2 \(\nu\)-SVC
\(\nu\)-support vector classification(\(\nu\)-SVC) Chang and Lin (2001)은 \(C\)-SVC의 이차계획식 (9.8)과 다른 형태로, 페널티 단가 \(C\) 대신 \(\nu\)라는 파라미터를 이용한 아래 최적화 문제의 해를 구한다.
\[\begin{equation} \begin{split} \min \text{ } & L_D = \sum_{i = 1}^{N} \sum_{j = 1}^{N} \alpha_i \alpha_j y_i y_j k_{ij}\\ \text{s.t. } &\\ & \sum_{i = 1}^{N} \alpha_i y_i = 0\\ & 0 \le \alpha_i \le \frac{1}{N}, \text{ } i = 1, \cdots, N\\ & \sum_{i = 1}^{N} \alpha_i = \nu \end{split} \tag{9.9} \end{equation}\]
이 때, 각 \(\alpha_i\)의 최대값은 \(1/N\)으로, \(\nu\)를 포함한 제약식을 무시할 때 모든 객체에 대한 \(\alpha_i\)값의 합의 이론적 최대치는 1이 되며, \(\nu \in (0, 1]\)은 전체 객체 중 서포트 벡터 객체의 개수를 제한하는 개념으로 생각할 수 있다. 식 (9.9)이 실제로 최적해를 가지기 위한 \(\nu\)값의 범위는
\[\begin{equation*} 0 < \nu \le \frac{2}{N} \min \left( \sum_i I(y_i = 1), \sum_i I(y_i = -1) \right) \end{equation*}\]
으로 (Chang and Lin 2001), 에를 들어 범주 1에 속하는 학습표본 객체 수가 전체의 10% 라면, \(\nu\) 값은 최대 0.2 까지 설정할 수 있다. 또한
svm 함수가 호출하는 LIBSVM 라이브러리는 위 식 (9.9)을 \(N\)이 큰(학습 표본 수가 매우 많은) 경우에도 안정된 결과를 얻을 수 있도록 아래와 같이 변환한 문제를 다룬다.
\[\begin{equation} \begin{split} \min \text{ } & L_D = \sum_{i = 1}^{N} \sum_{j = 1}^{N} \bar{\alpha}_i \bar{\alpha}_j y_i y_j k_{ij}\\ \text{s.t. } &\\ & \sum_{i = 1}^{N} \bar{\alpha}_i y_i = 0\\ & 0 \le \bar{\alpha}_i \le 1, \text{ } i = 1, \cdots, N\\ & \sum_{i = 1}^{N} \bar{\alpha}_i = \nu N \end{split} \tag{9.10} \end{equation}\]
이 때 \(\bar{\alpha}_i = \alpha_i N\)이다.
\(\nu\)-SVC은 아래와 같이 svm 함수를 호출할 때 type = "nu-classification"과 파라미터 nu 값을 설정함으로써 학습할 수 있다.
svm_model <- svm(as.factor(class) ~ x1 + x2, data = nonlinear_train_df,
                 type = "nu-classification",
                 kernel = "radial", gamma = 1,
                 nu = 0.5, scale = FALSE)
plot(svm_model, data = nonlinear_train_df, formula = x2 ~ x1, grid = 200)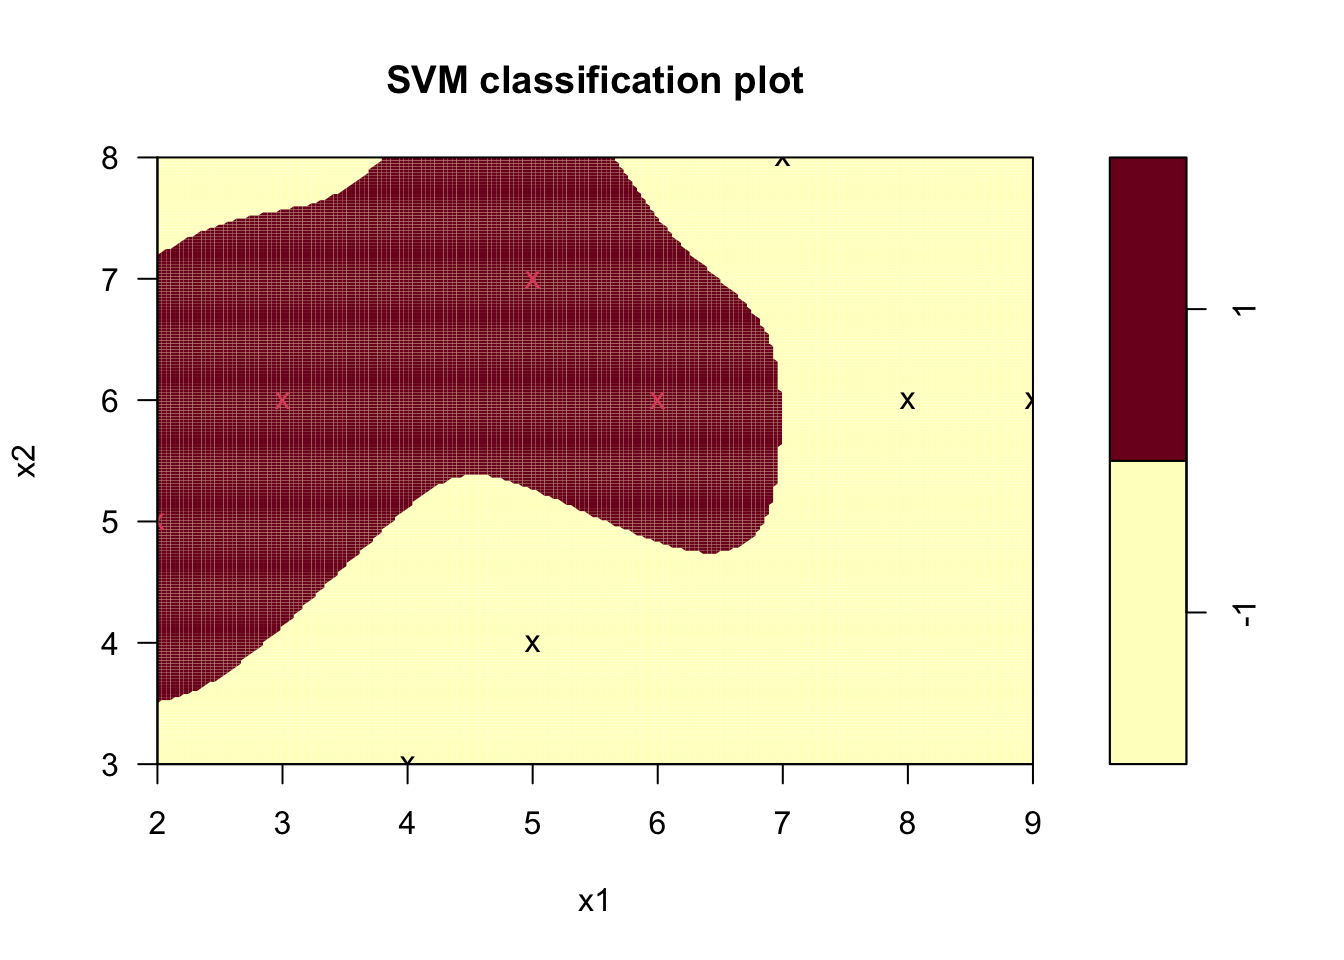
Figure 9.7: 가우시안 커널을 이용한 \(\nu\)-SVC 하이퍼플레인